
Thursday, March 8, 2018

Wednesday, March 7, 2018
Home Prices: The Difference 5 Years Makes

The economists at CoreLogic recently released a special report entitled, Evaluating the Housing Market Since the Great Recession. The goal of the report was to look at economic recovery since the Great Recession of December 2007 through June 2009.
One of the key indicators used in the report to determine the health of the housing market was home price appreciation. CoreLogic focused on appreciation from December 2012 to December 2017 to show how prices over the last five years have fared.
Frank Nothaft, Chief Economist at CoreLogic, commented on the importance of breaking out the data by state,
“Homeowners in the United States experienced a run-up in prices from the early 2000s to 2006, and then saw the trend reverse with steady declines through 2011. After finally reaching bottom in 2011, home prices began a slow rise back to where we are now.The map below was created to show the 5-year appreciation from December 2012 – December 2017 by state.
Greater demand and lower supply – as well as booming job markets – have given some of the hardest-hit housing markets a boost in home prices. Yet, many are still not back to pre-crash levels.”
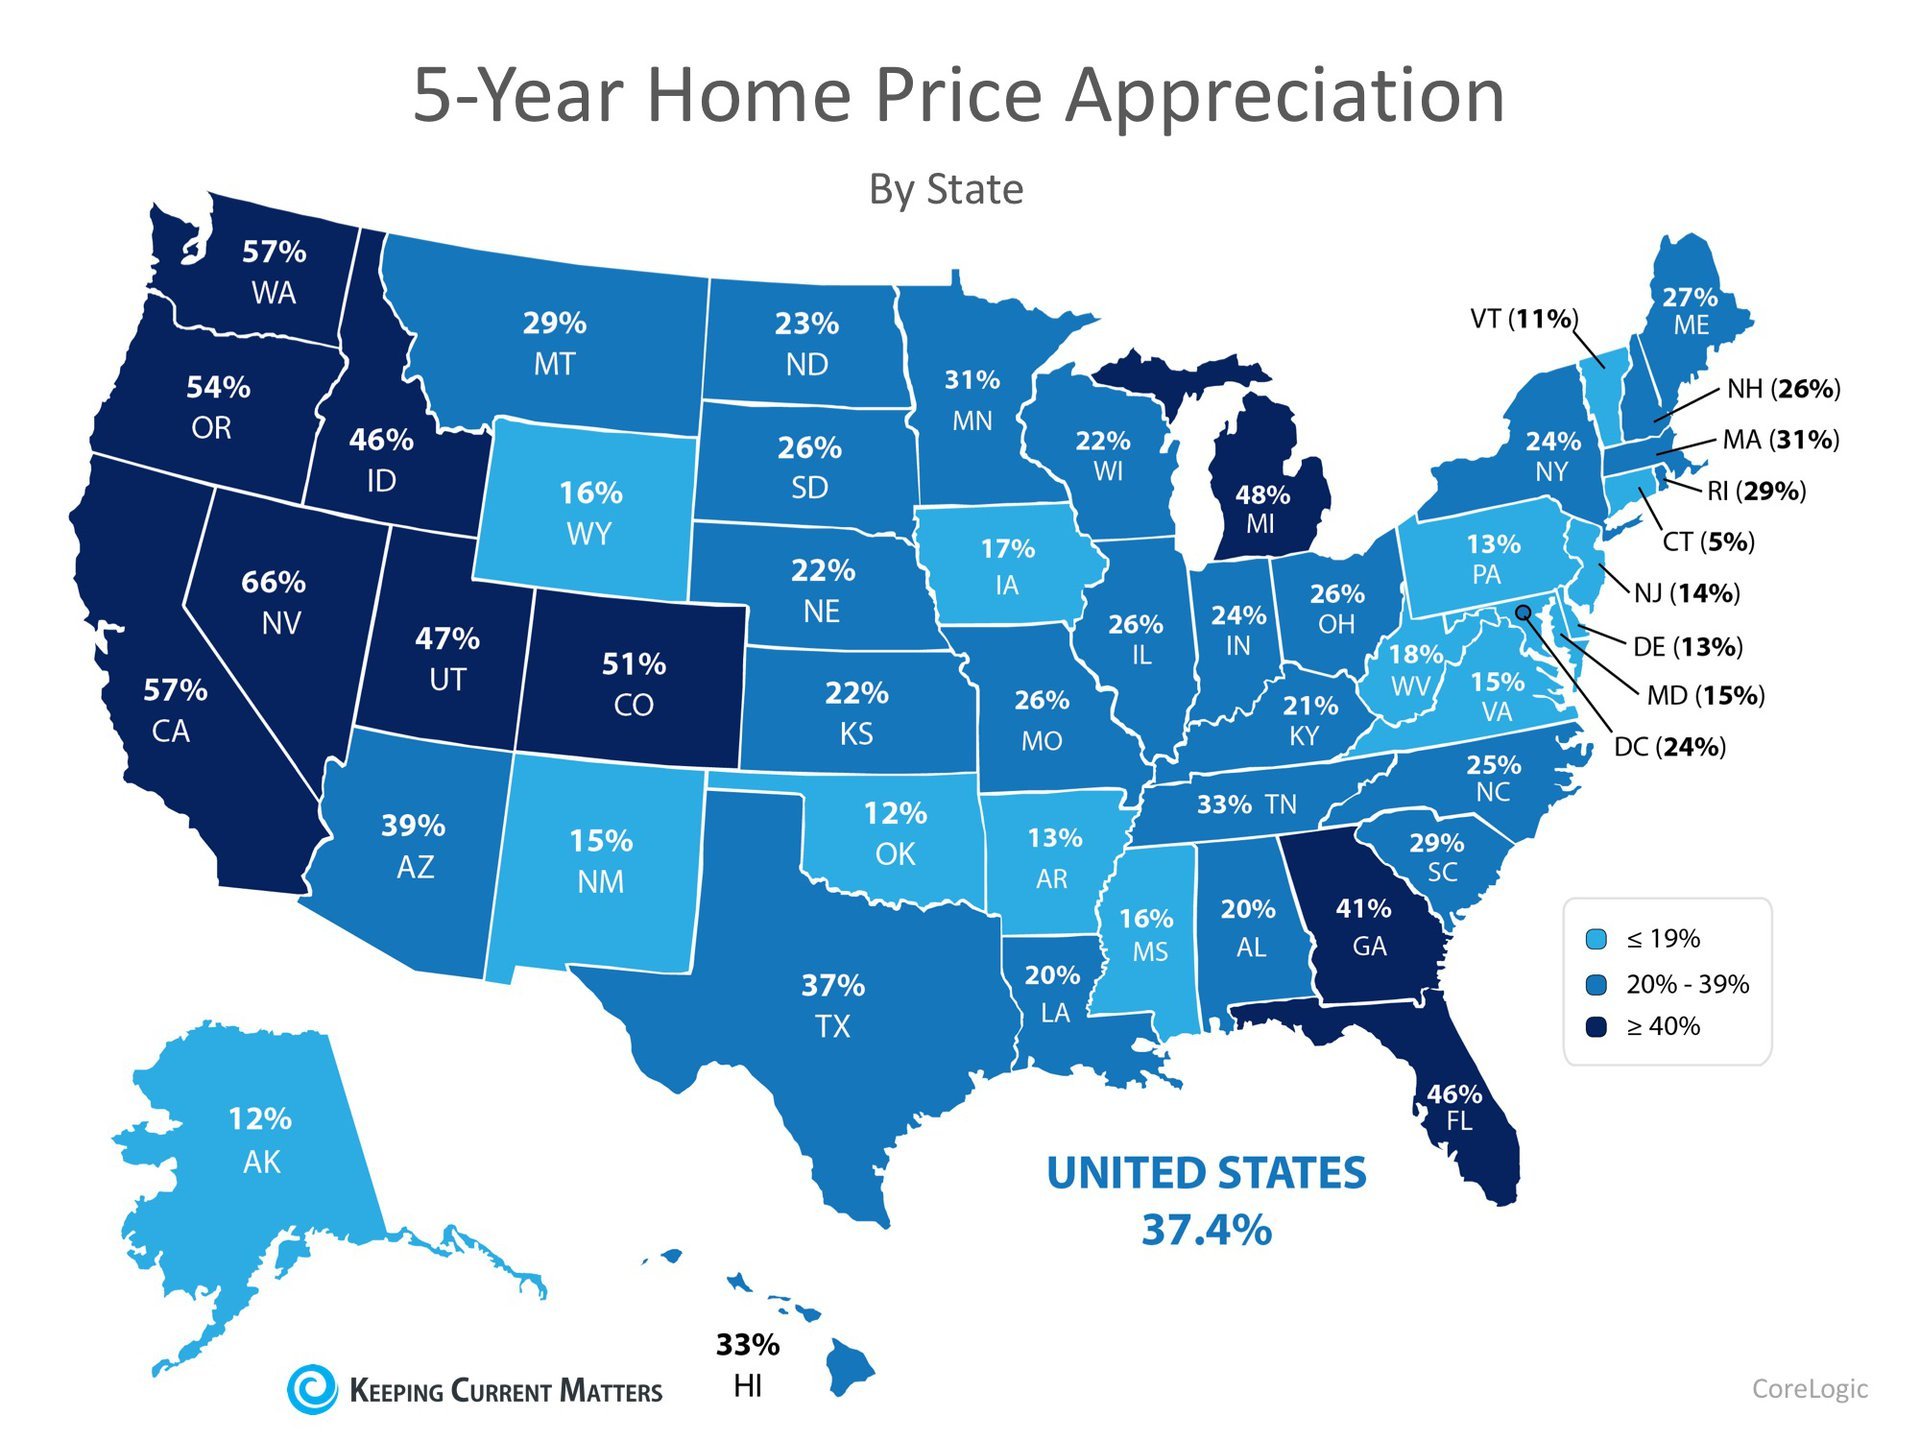
Nationally, the cumulative appreciation over the five-year period was 37.4%, with a high of 66% in Nevada, and a modest increase of 5% in Connecticut.
Where were prices expected to go?
Every quarter, Pulsenomics surveys a nationwide panel of over 100 economists, real estate experts, and investment and market strategists and asks them to project how residential home prices will appreciate over the next five years for their Home Price Expectation Survey (HPES).According to the December 2012 survey results, national homes prices were projected to increase cumulatively by 23.1% by December 2017. The bulls of the group predicted home prices to rise by 33.6%, while the more cautious bears predicted an appreciation of 11.2%.
Where are prices headed in the next 5 years?
Data from the most recent HPES shows that home prices are expected to increase by 18.2% over the next 5 years. The bulls of the group predict home prices to rise by 27.4%, while the more cautious bears predict an appreciation of 8.3%.Bottom Line
Every day, thousands of homeowners regain positive equity in their homes. Some homeowners are now experiencing values even higher than before the Great Recession. If you’re wondering if you have enough equity to sell your house and move on to your dream home, contact a local real estate professional who can help!Tuesday, March 6, 2018
Home Disclosures

At what point during the selling process does an owner have to disclose information about a house to a buyer?
[The owner discloses information] normally during the option period. An option period is a negotiable date, meaning that once it’s an executed contract, you [have]10 days to make sure the house is in working condition and there’s no issues during that time frame. If you do that and everything is okay, then you move forward. But if for some reason there is a problem with the house, and we found it during the inspection time, then the buyer can actually back out. The option period is a negotiable time frame.
Buying A Home In A Seller's Market

When
there are too many buyers and not enough houses, this is often referred
to as a seller’s market. When this happens, houses usually are sold
quickly and buyers often pay a higher price. If you are trying to buy in
a seller’s market, here are a few tips to help you get your dream home.
timgrissett.com
timgrissett.com
Monday, March 5, 2018
Housing Market Expected To "Spring Forward" This Year

Just like our clocks this weekend in the majority of the country, the housing market will soon “spring forward!” Similar to tension in a spring, the lack of inventory available for sale in the market right now is what is holding back the market.
Many potential sellers believe that waiting until Spring is in their best interest, and traditionally they would have been right.
Buyer demand has seasonality to it, which usually falls off in the winter months, especially in areas of the country impacted by arctic temperatures and conditions.
That hasn’t happened this year.
Demand for housing has remained strong as mortgage rates have remained near historic lows. Even with the recent increase in rates, buyers are still able to lock in an affordable monthly payment. Many more buyers are jumping off the fence and into the market to secure a lower rate.The National Association of Realtors (NAR) recently reported that the top 10 dates sellers listed their homes in 2017 all fell in April, May, or June.
Those who act quickly and list now could benefit greatly from additional exposure to buyers prior to a flood of more competition coming to market in the next few months.
Bottom Line
If you are planning on selling your home in 2018, meet with a local real estate professional to evaluate the opportunities in your market.
Friday, March 2, 2018
4 Reasons to Sell This Spring

- Buyer demand continues to outpace the supply of homes for sale which means that buyers are often competing with one another for the few listings that are available!
- Housing inventory is still under the 6-month supply needed to sustain a normal housing market.
- Perhaps the time has come for you and your family to move on and start living the life you desire.
Thursday, March 1, 2018
Are Home Values Really Overinflated?

Last week, the National Association of Realtors (NAR) released their most recent Existing Home Sales Report. According to the report:
“The median existing-home price for all housing types in January was $240,500, up 5.8 percent from January 2017 ($227,300). January’s price increase marks the 71st straight month of year-over-year gains.”Seventy-one consecutive months of price increases may have some concerned that current home values may be overinflated.
However, at the same time, Zillow issued a press release which revealed:
“If the housing bubble and bust had not happened, and home values had instead appreciated at a steady pace, the median home value would be higher than its current value.”Here are two graphs that help show why home prices are exactly where they should be.
The first graph shows actual median home sales prices from 2000 through 2017.
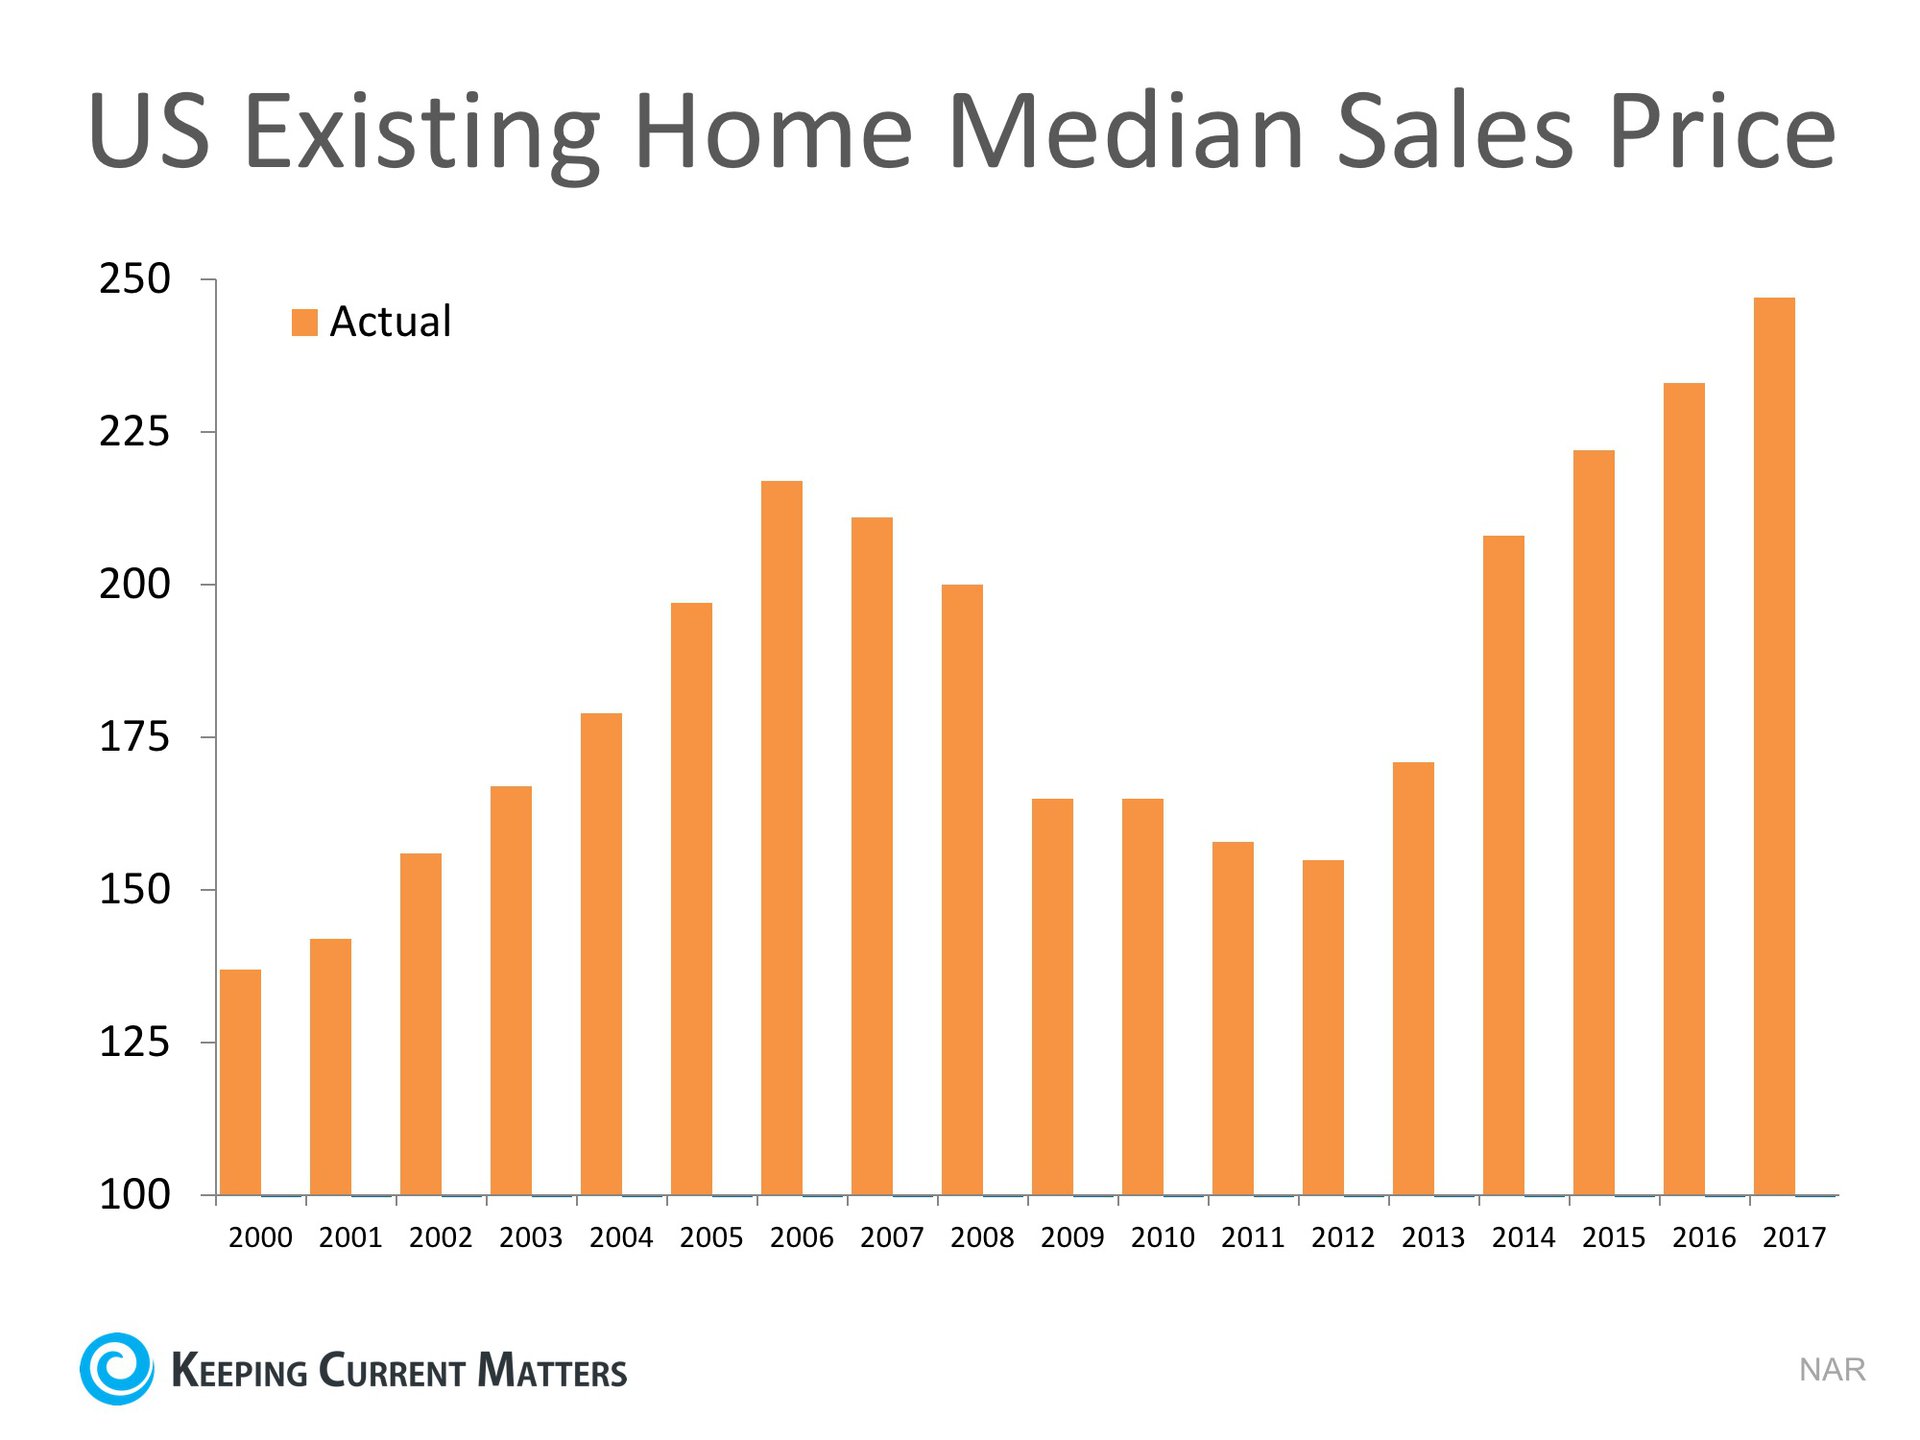
By itself, this graph could heighten concerns as it shows home values rose in the early 2000s, came tumbling down and are now headed up again. It gives the feel of a rollercoaster ride that is about to take another turn downward.
However, if we also include where prices would naturally be, had there not been a boom & bust, we see a different story.
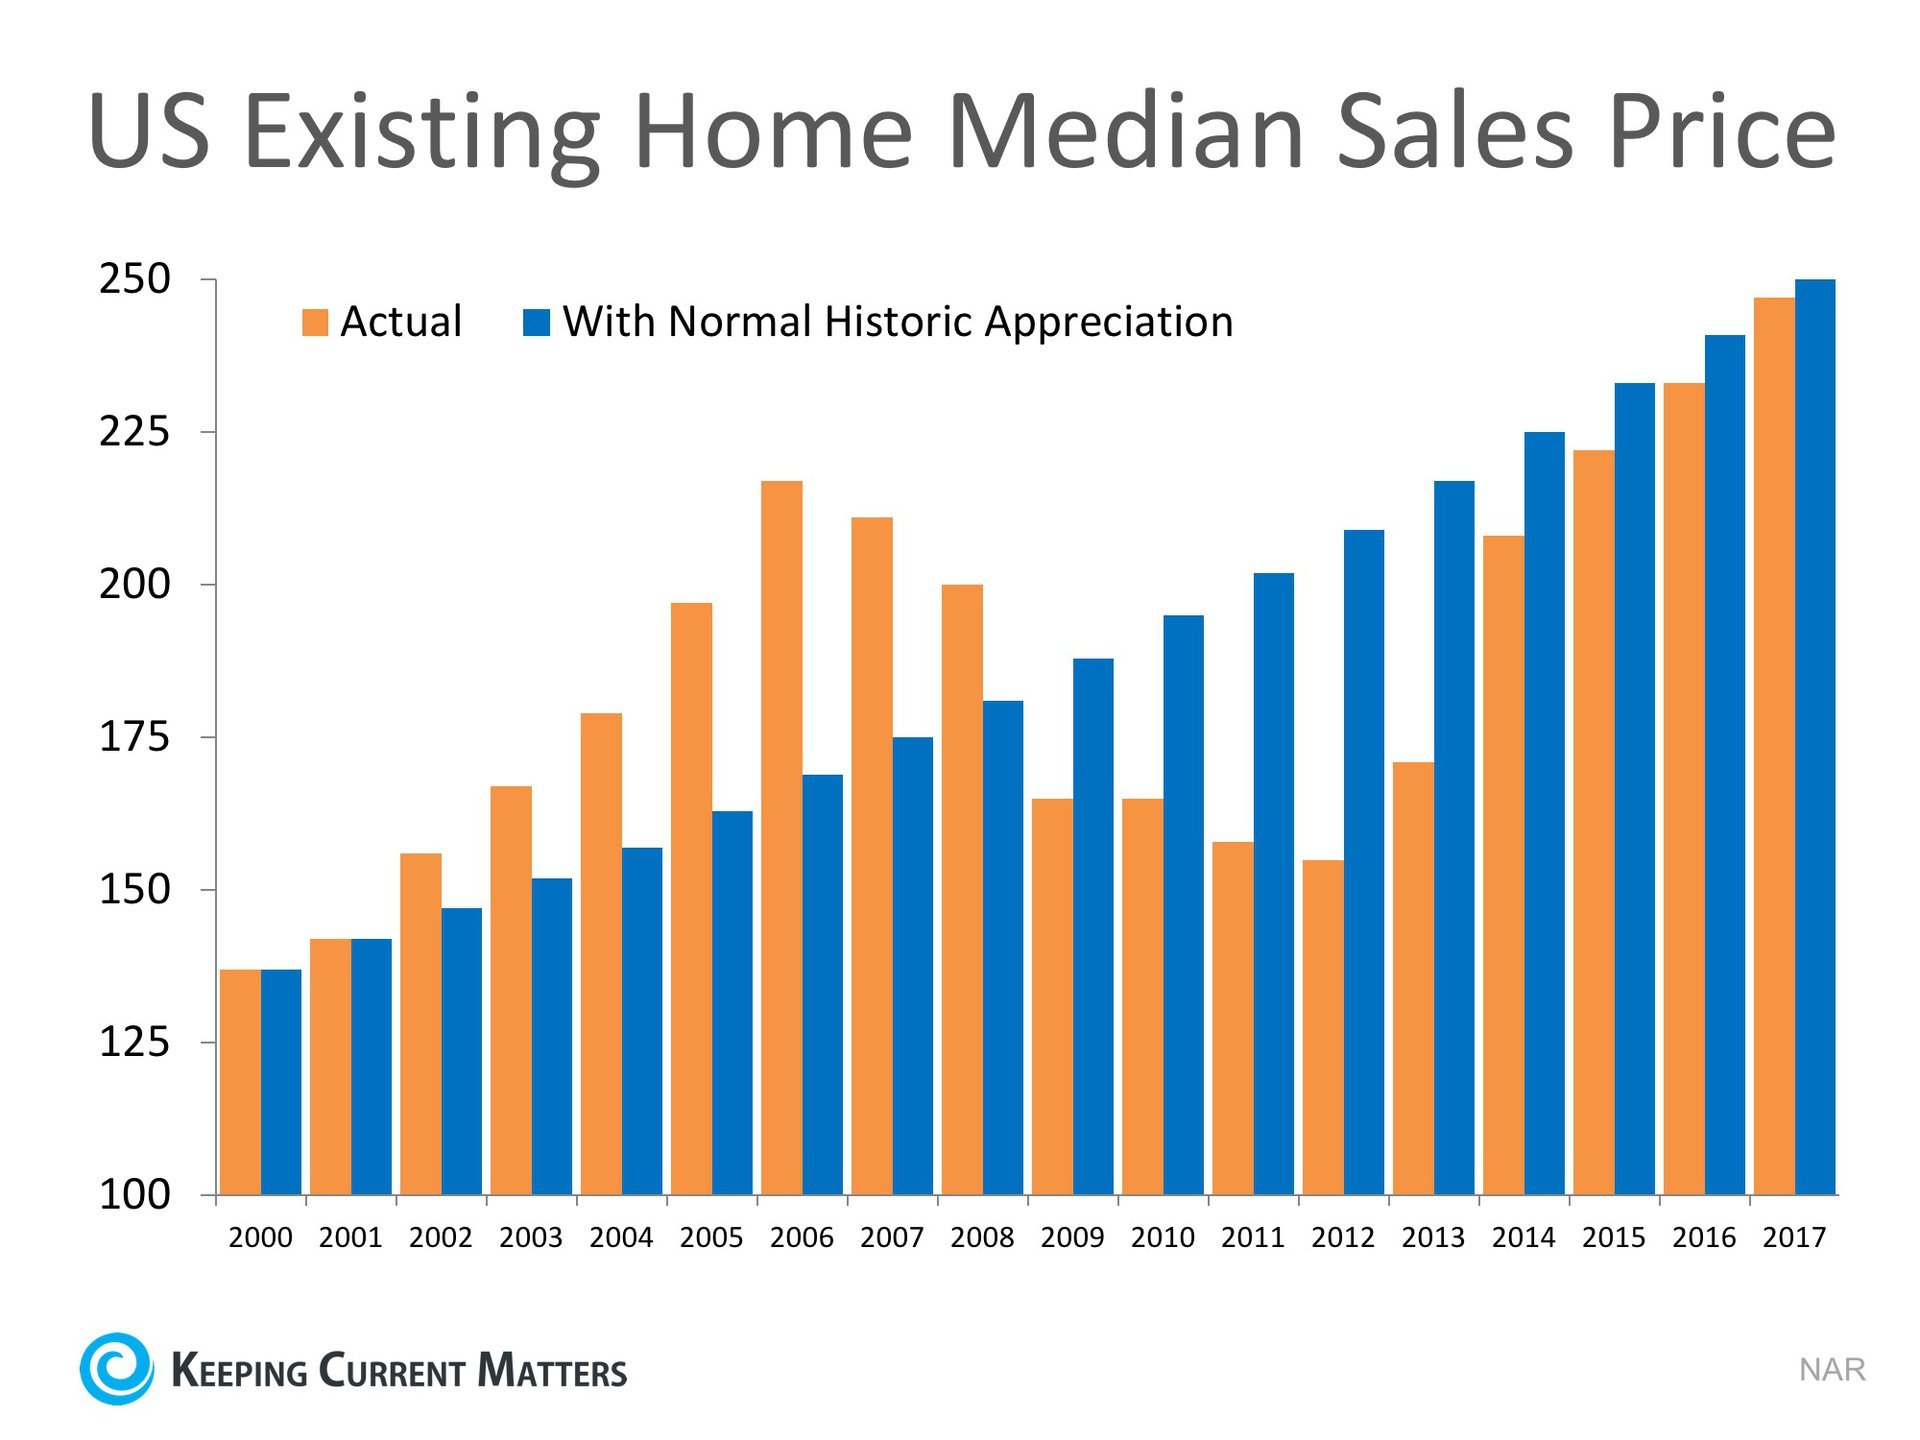
The blue bars on this graph represent were prices would be if they had increased by the normal annual appreciation rate (3.6%). By adding 3.6% to the actual 2000 price and repeating that for each subsequent year, we can see that prices were overvalued during the boom, undervalued during the bust, and a little bit LOWER than where they should be right now.
Bottom Line
Based on historic appreciation levels, we should be very comfortable that current home values are not overinflated.
Subscribe to:
Posts (Atom)